
Monitoring
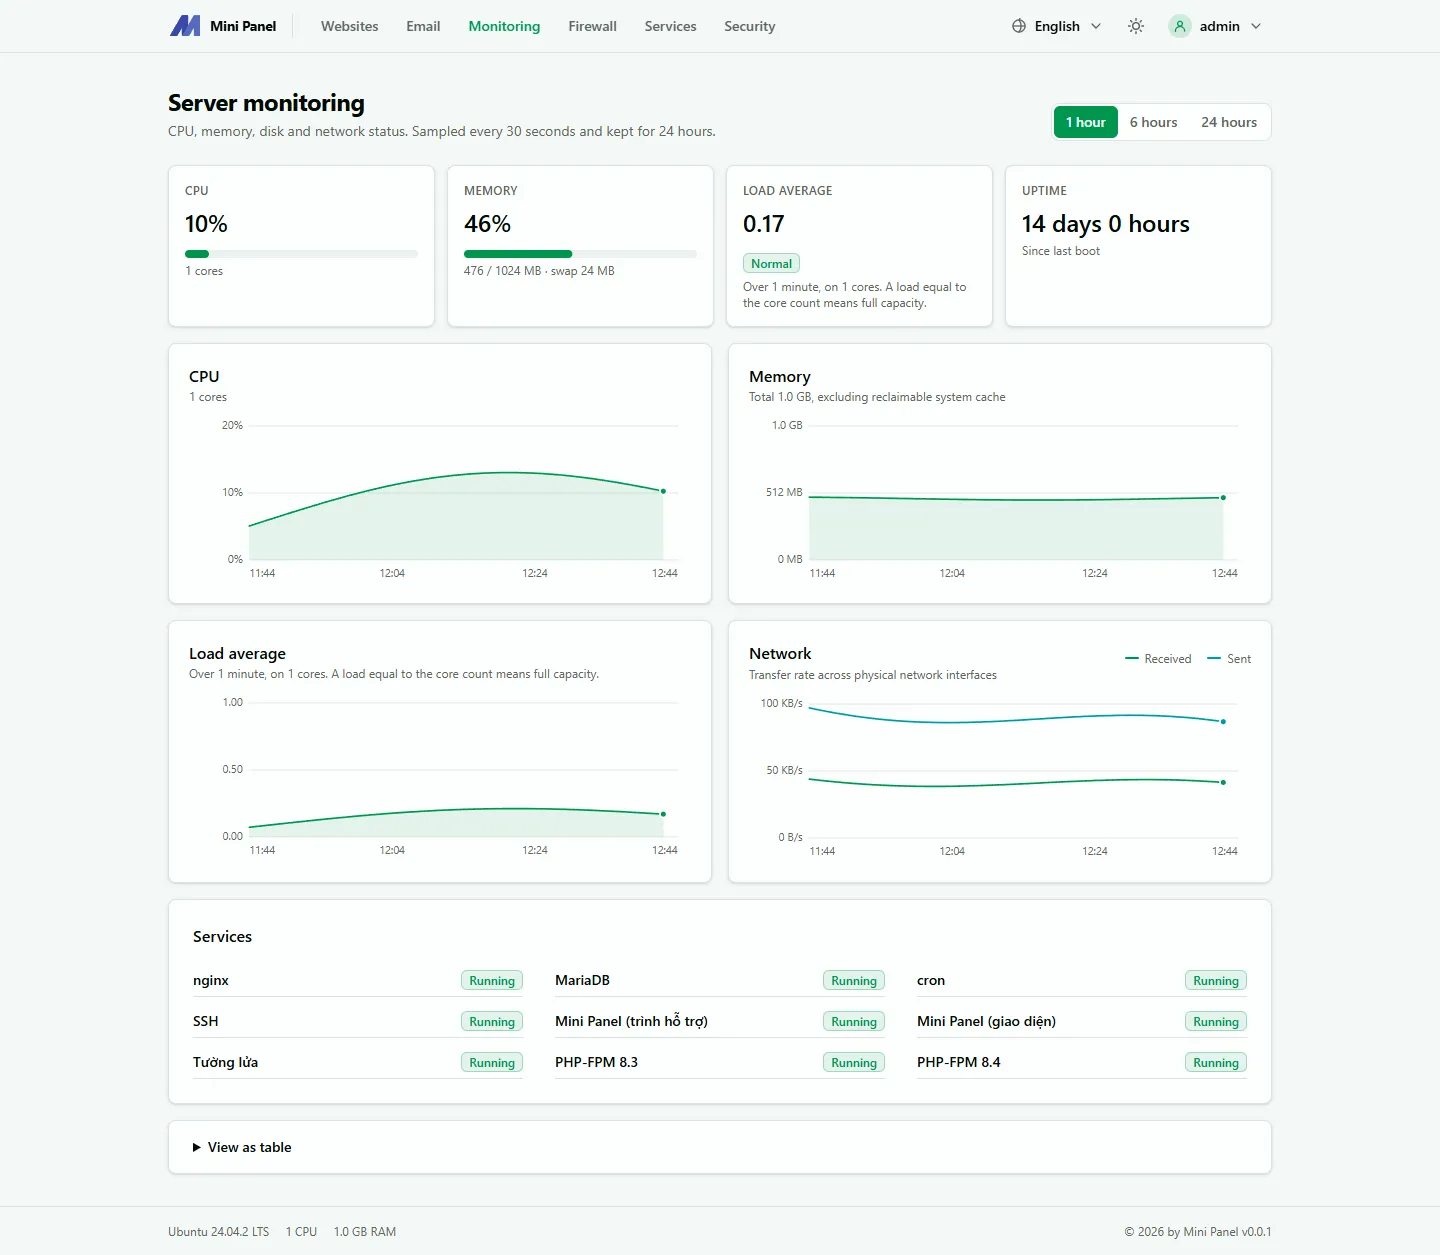
The Monitoring page shows the state of the processor, memory, disks and network. Figures are sampled every 30 seconds and kept for 24 hours. A freshly installed panel needs a few minutes to collect two samples before charts appear.
Time range
Section titled “Time range”Choose 1 hour, 6 hours or 24 hours to change the range of the charts. Each chart can also be viewed as a table.
Metrics
Section titled “Metrics”- Processor: CPU usage and core count.
- Memory: used memory, excluding reclaimable system cache, plus swap.
- Load average: 1-minute load compared with the core count. A load equal to the core count is full. Labels: Normal, Fairly high, Overloaded.
- Uptime: since the last boot.
- Disk: usage per partition. The Filling up and Almost full labels warn early.
- Network: receive and send speed across physical network interfaces.
- Services: Running, Stopped or Failed. Manage them in Services.